

It’s unfortunate that Apple do not provide a charting library bundled with their frameworks, for I suspect that would save many developers the trouble of finding a charting library and deciphering the documentation. I’ve come to the conclusion that CorePlot is the best bet at the moment - it’s powerful and compatible with both iOS and OSX but unfortunately the documentation for isn’t great. So, we’re going to go through the process of adding a simple scatter chart to an iPad application.
Our goal is to build an application that contains a simple scatter graph with data stored in an NSArray (which could easily have been loaded from a CSV file). We aim to add this in a generic fashion, in a sub-view of a NIB file - so that you could drop this work into an app you’re working on without much work. We target the iPad, but the same method will work for the iPhone without any changes and will also work on OSX if you make a couple of minor changes.
This tutorial assumes that basic iOS programming knowledge and experience. Before we start, it’s worth noting that CorePlot is a very flexible library - it just takes a bit of getting used to. Unfortunately, the base documentation doesn’t help much when you’re getting started - so I’ll try to expose as much as I currently know about the library.
1. Starting a new Project
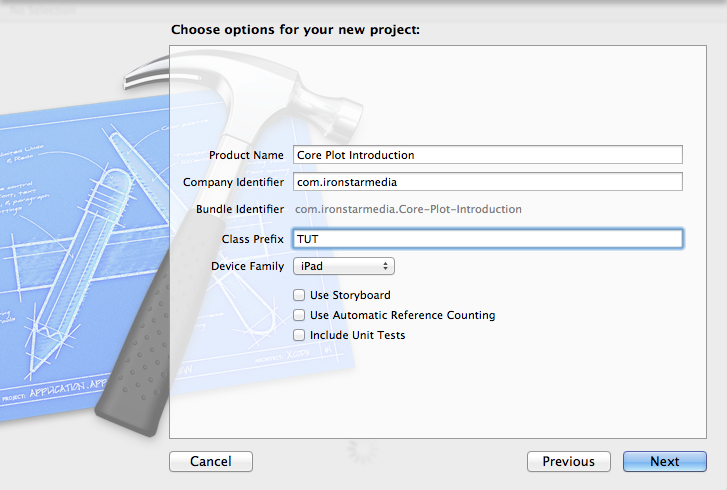
We’re going to develop a simple single-view iPad application - but you can add your CorePlot to any existing view in an application using the same method presented here. I use a class prefix of TUT to represent any classes I build during this tutorial.
2. Acquiring and Installing CorePlot
When your project is ready and waiting, the first thing we will do is install the CorePlot library, which will expose the classes necessary for you to get started in adding your scatterplot to your application. Head over to the CorePlot website and download the latest zip file. This tutorial is based on CorePlot 0.9, so if the code has changed significantly in the future - you might want to download version 0.9 to work through this tutorial and then figure out how the code has changed later.
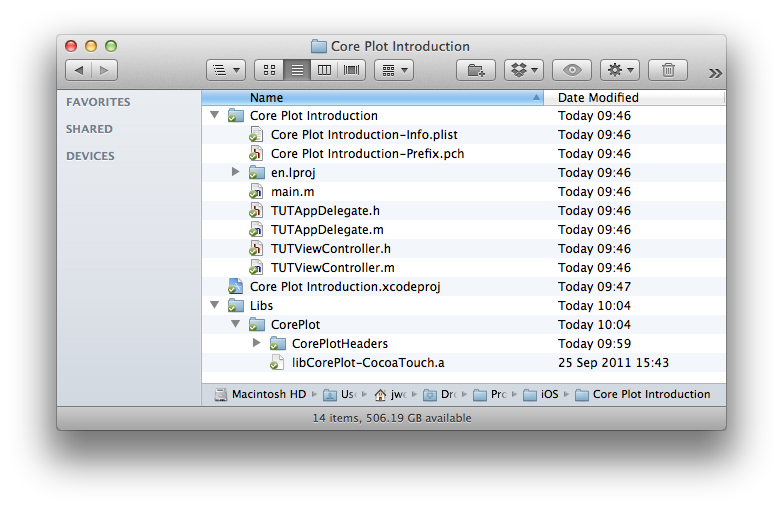
When your download is complete, unzip the files in your Downloads directory. We’re going to install the static library, where the code has already been compiled as libCorePlot-CocoaTouch.a, but you could install the source-code version instead if you prefer - which would then recompile CorePlot when you build your app. Both methods are essentially the same, as you’ll still need to include the header files so that your code can access the methods. I keep my external libraries separate from my own source code, so we’re going to add a new folder at the root of our project called ‘Libs’ and then create a sub-directory inside that called ‘CorePlot’. Now, from the zip file that you downloaded - you want to copy libCorePlot-CocoaTouch.a and the folder CorePlotHeaders from the folder CorePlot_0.9/Binaries/iOS/. Your directory structure should look like this;
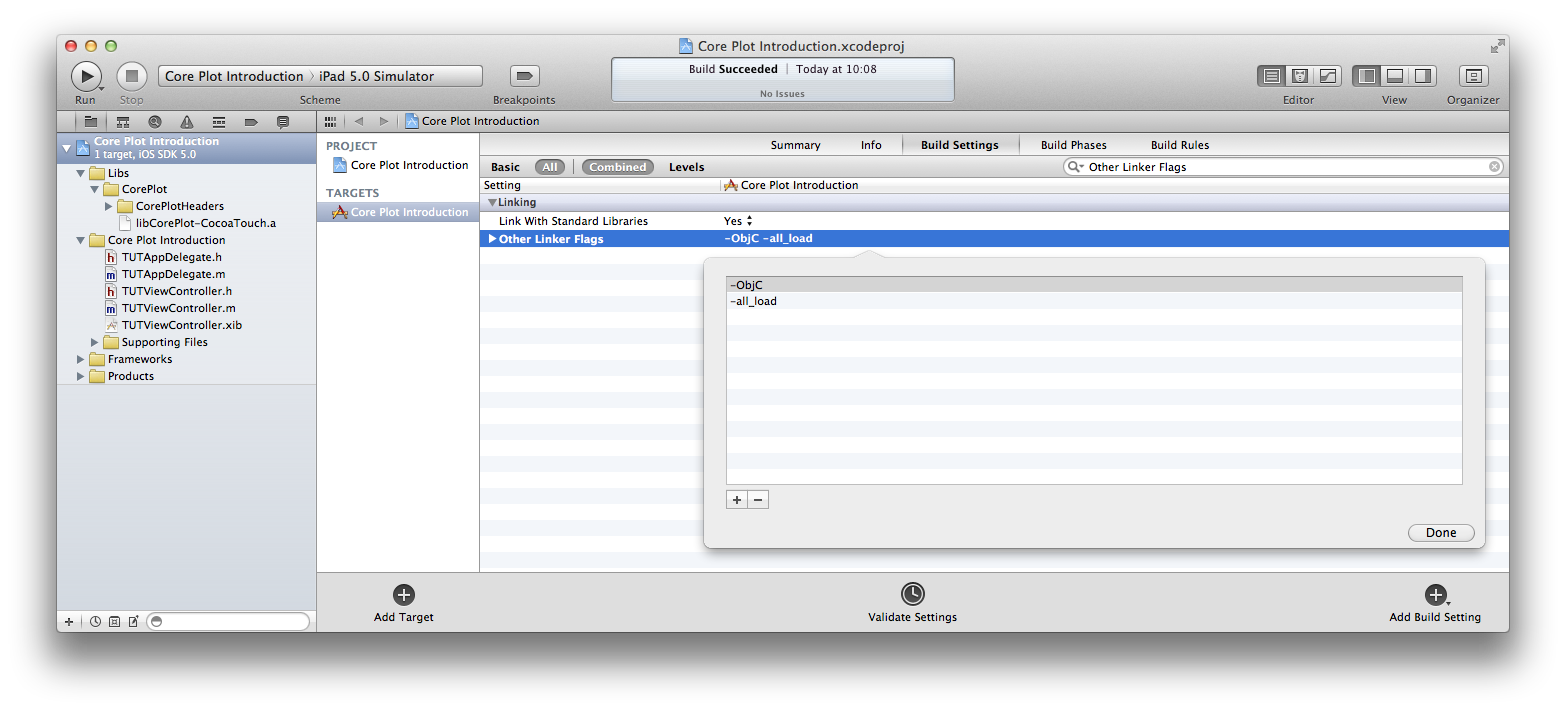
Now that your files are in place, you just need to add them to your Xcode project. Drag and drop the whole Libs folder onto your Xcode file tree. Or, you can use the File -> Add Files to “Core Plot Introduction” option from the files menu and select the Libs folder. There should now be a Libs folder in your project sidebar containing the CorePlotHeaders and the libCorePlot file. Now, there are a couple of settings we need to tweak to get CorePlot working before we can start to implement our scatter plot. Select your project from the navigator panel in Xcode and then highlight the Build Settings tab. Filter the settings or locate ‘Other Linker Flags’ from this list and then add -ObjC -all_load to these settings, as shown in the next figure;
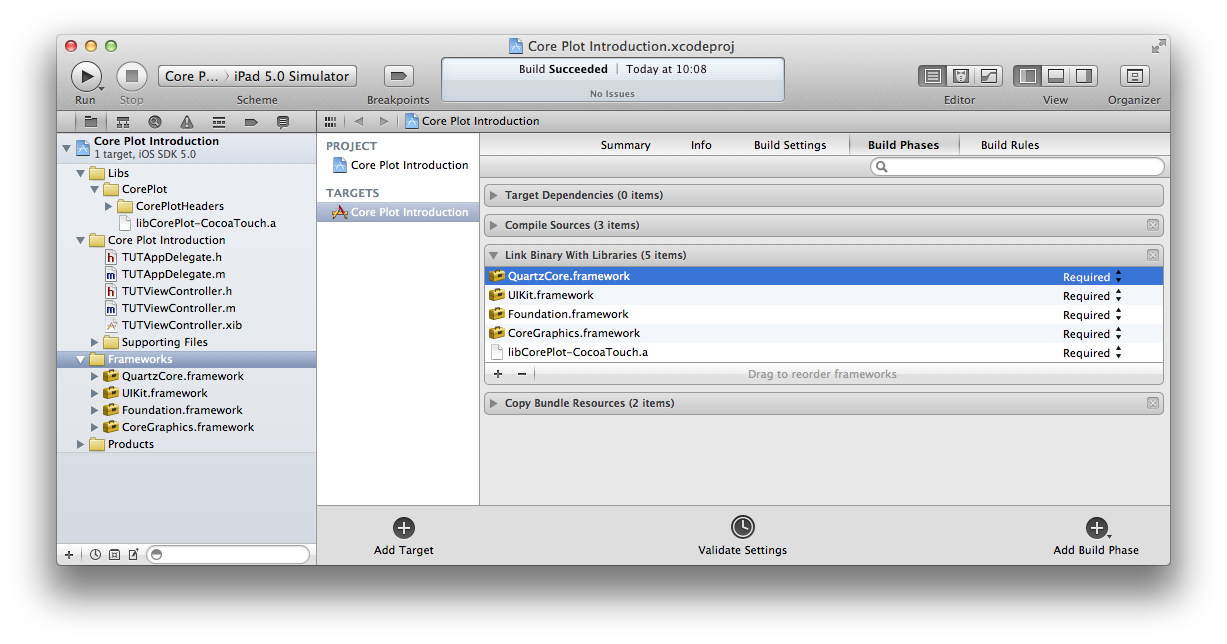
There’s just one more step before we can start working with CorePlot in our application. As CorePlot makes use of Apple’s Core Animation code, which is a part of the QuartzCore framework - we need to ensure that our project is linking against the QuartzCore code. With the project still selected in Xcode, highlight the Build Phases tab. Expand the Link Binary with Libraries panel and click on the plus button at the bottom. Now select QuartzCore.framework from the list and hit ok. I usually copy the reference in my project into the Framework folder to be tidy - but this isn’t a necessity.
3. Adding a Graph Hosting View to our Interface
In order to add a CorePlot chart space to our application, we start by setting up a ‘Hosting View’ which we will later attach our graph(s) too. We’re just creating a placeholder in our NIB at the moment, into which we will tell CorePlot to start drawing using our code later on.
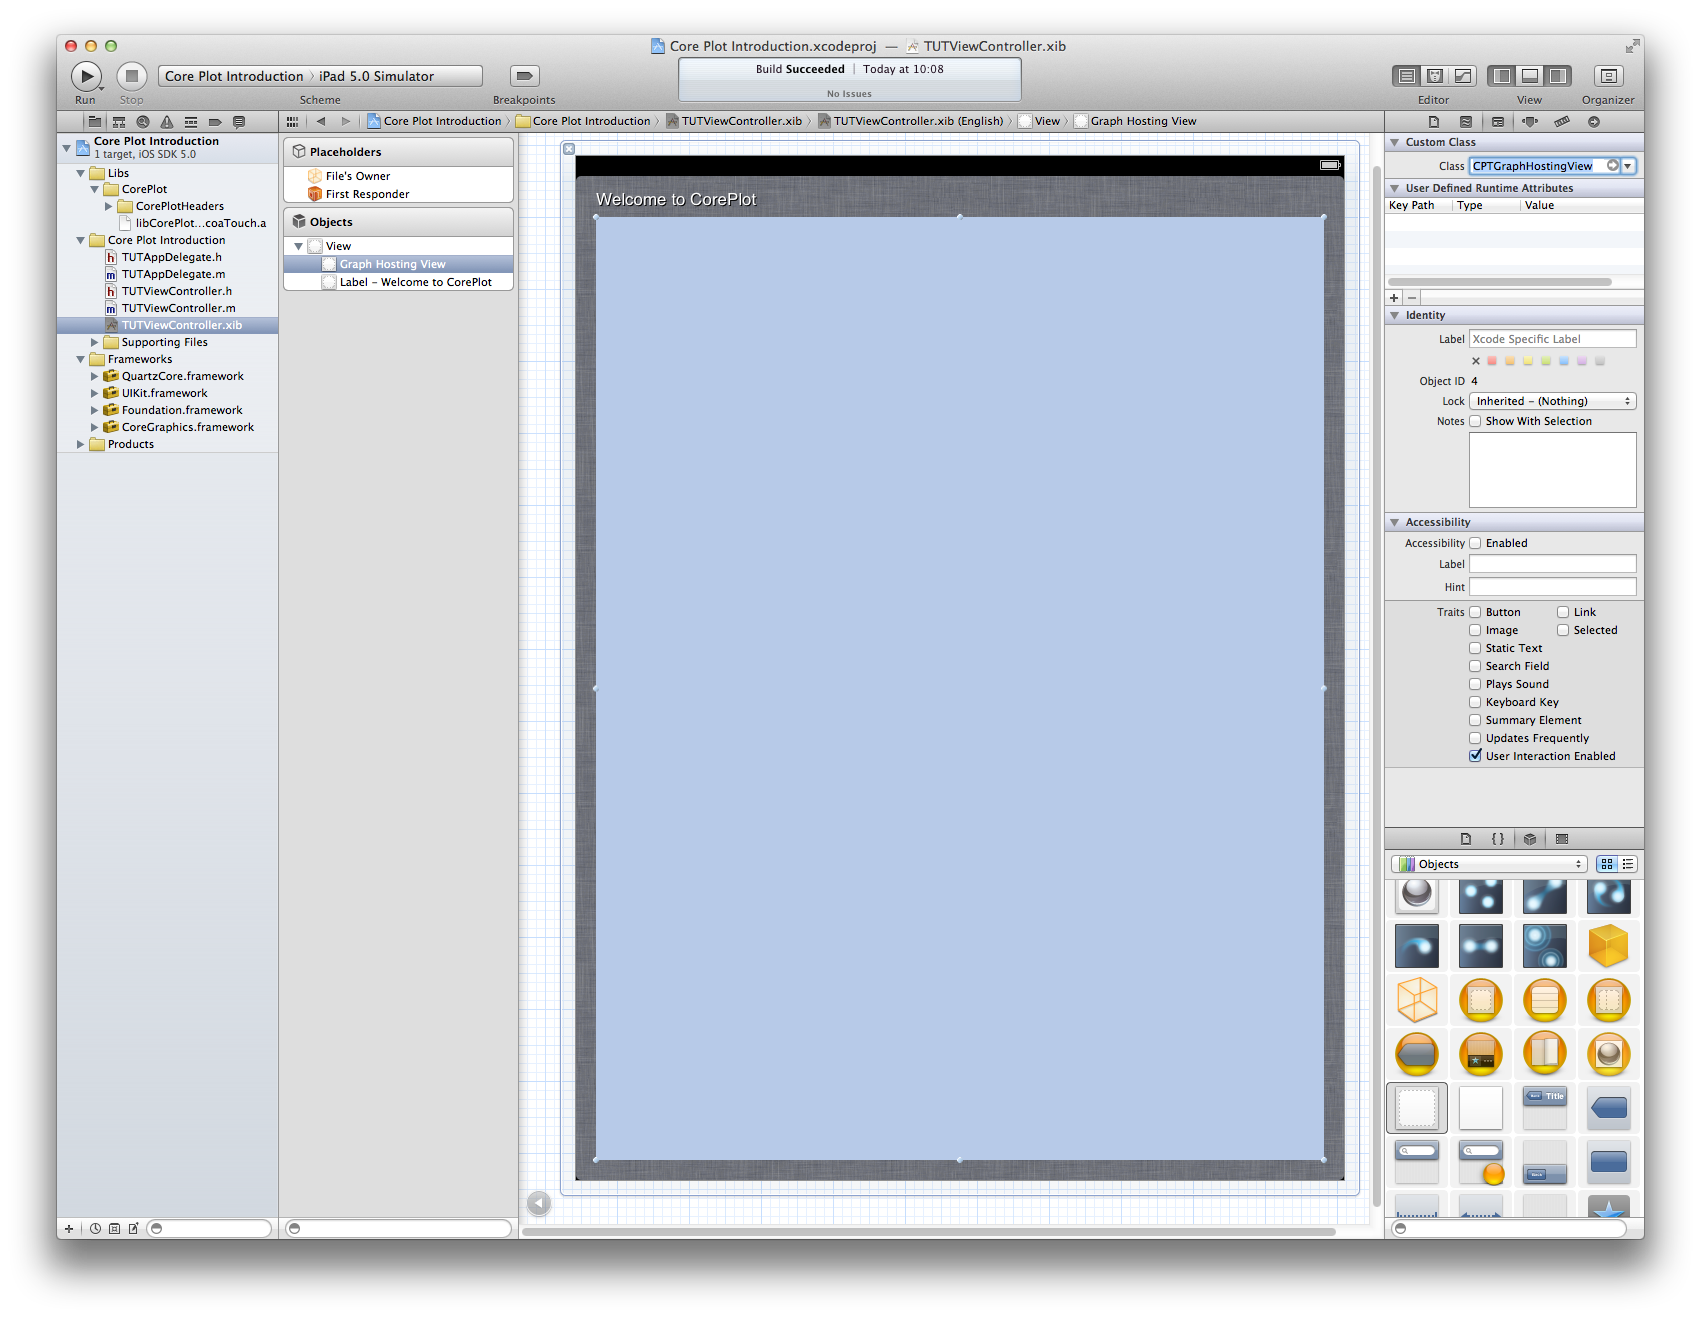
We start by adding a label to the top of the interface with some dummy text and change the background colour of the main XIB view to Scroll View Textured Background Color to make it looks swish. Next, drag and drop a UIView component from the object library onto your project. You would normally make this as big as possible, as we would adding padding within CorePlot (to leave spill over space for axis labels). However, for this tutorial - I’ve left a border to make it easier to see what’s going on in the figures. Next, select the view you’ve just added and change it’s class in the property panel to the right. It’s class should be; CPTGraphHostingView. You should now have something that looks like the next figure (notice the object hierarchy on the left and the UIView’s class at the top right).
4. Creating our Scatter Plot object
CorePlot acquires data for its plots much like UITableView does - by calling specific methods on the class you have set as the Graph’s delegate. Incidentally, it also delegates many of it’s features this way too, for instance if you want the user to be able to interact with the chart. So, much like a table view, you could set the main ViewController as your delegate and not add an extra class to your code. However, in order to keep your charts re-usable and interchangeable, I think it’s best to create a new class that will do all the work for your chart.
So, we add a new class to our project TUTSimpleScatterPlot, which is simply a subclass of NSObject. In TUTSimpleScatterPlot.h we need to import the CorePlot libraries; #import “CorePlot-CocoaTouch.h” and then we define a few properties for the objects we need to keep a reference too. The header file for our chart object looks like this…
TUTSimpleScatterPlot.h
#import
#import "CorePlot-CocoaTouch.h"

@interface TUTSimpleScatterPlot : NSObject  {
	CPTGraphHostingView *_hostingView;
	CPTXYGraph *_graph;
	NSMutableArray *_graphData;
}

@property (nonatomic, retain) CPTGraphHostingView *hostingView;
@property (nonatomic, retain) CPTXYGraph *graph;
@property (nonatomic, retain) NSMutableArray *graphData;

// Method to create this object and attach it to it's hosting view.
-(id)initWithHostingView:(CPTGraphHostingView *)hostingView andData:(NSMutableArray *)data;

// Specific code that creates the scatter plot.
-(void)initialisePlot;

@end
We need to keep hold of 3 objects to make our chart work. We will pass the hosting view from our XIB file and an array of data when we call initWithHostingView:andData: while creating an instance of our chart. We create the CPTXYGraph and setup our chart when initialisePlot is called - which we will usually call shortly after we initialise our object. Notice we have stated that our object responds to the CPTScatterPlotDataSource delegate methods in the class definition.
Next, we’re going to write the init and initialisePlot methods, as well as the methods from the CPTScatterPlotDataSource protocol required to get our chart working. In time honoured tradition, I’ll throw the code at you first, and then explain it. While it looks like a lot of code, most of it involves configuring certain graph elements - it’s simpler than it first appears.
TUTSimpleScatterPlot.m
#import "TUTSimpleScatterPlot.h"

@implementation TUTSimpleScatterPlot
@synthesize hostingView = _hostingView;
@synthesize graph = _graph;
@synthesize graphData = _graphData;

// Initialise the scatter plot in the provided hosting view with the provided data.
// The data array should contain NSValue objects each representing a CGPoint.
-(id)initWithHostingView:(CPTGraphHostingView *)hostingView andData:(NSMutableArray *)data
{
	self = [super init];

	if ( self != nil ) {
		self.hostingView = hostingView;
		self.graphData = data;
		self.graph = nil;
	}

	return self;
}

// This does the actual work of creating the plot if we don't already have a graph object.
-(void)initialisePlot
{
	// Start with some simple sanity checks before we kick off
	if ( (self.hostingView == nil) || (self.graphData == nil) ) {
		NSLog(@"TUTSimpleScatterPlot: Cannot initialise plot without hosting view or data.");
		return;
	}

	if ( self.graph != nil ) {
		NSLog(@"TUTSimpleScatterPlot: Graph object already exists.");
		return;
	}

	// Create a graph object which we will use to host just one scatter plot.
	CGRect frame = [self.hostingView bounds];
	self.graph = [[[CPTXYGraph alloc] initWithFrame:frame] autorelease];

	// Add some padding to the graph, with more at the bottom for axis labels.
	self.graph.plotAreaFrame.paddingTop = 20.0f;
	self.graph.plotAreaFrame.paddingRight = 20.0f;
	self.graph.plotAreaFrame.paddingBottom = 50.0f;
	self.graph.plotAreaFrame.paddingLeft = 20.0f;

	// Tie the graph we've created with the hosting view.
	self.hostingView.hostedGraph = self.graph;

	// If you want to use one of the default themes - apply that here.
	//[self.graph applyTheme:[CPTTheme themeNamed:kCPTDarkGradientTheme]];

	// Create a line style that we will apply to the axis and data line.
	CPTMutableLineStyle *lineStyle = [CPTMutableLineStyle lineStyle];
	lineStyle.lineColor = [CPTColor whiteColor];
	lineStyle.lineWidth = 2.0f;

	// Create a text style that we will use for the axis labels.
	CPTMutableTextStyle *textStyle = [CPTMutableTextStyle textStyle];
	textStyle.fontName = @"Helvetica";
	textStyle.fontSize = 14;
	textStyle.color = [CPTColor whiteColor];

	// Create the plot symbol we're going to use.
	CPTPlotSymbol *plotSymbol = [CPTPlotSymbol crossPlotSymbol];
	plotSymbol.lineStyle = lineStyle;
	plotSymbol.size = CGSizeMake(8.0, 8.0);

	// Setup some floats that represent the min/max values on our axis.
	float xAxisMin = -10;
	float xAxisMax = 10;
	float yAxisMin = 0;
	float yAxisMax = 100;

	// We modify the graph's plot space to setup the axis' min / max values.
	CPTXYPlotSpace *plotSpace = (CPTXYPlotSpace *)self.graph.defaultPlotSpace;
	plotSpace.xRange = [CPTPlotRange plotRangeWithLocation:CPTDecimalFromFloat(xAxisMin) length:CPTDecimalFromFloat(xAxisMax - xAxisMin)];
	plotSpace.yRange = [CPTPlotRange plotRangeWithLocation:CPTDecimalFromFloat(yAxisMin) length:CPTDecimalFromFloat(yAxisMax - yAxisMin)];

	// Modify the graph's axis with a label, line style, etc.
	CPTXYAxisSet *axisSet = (CPTXYAxisSet *)self.graph.axisSet;

	axisSet.xAxis.title = @"Data X";
	axisSet.xAxis.titleTextStyle = textStyle;
	axisSet.xAxis.titleOffset = 30.0f;
	axisSet.xAxis.axisLineStyle = lineStyle;
	axisSet.xAxis.majorTickLineStyle = lineStyle;
	axisSet.xAxis.minorTickLineStyle = lineStyle;
	axisSet.xAxis.labelTextStyle = textStyle;
	axisSet.xAxis.labelOffset = 3.0f;
	axisSet.xAxis.majorIntervalLength = CPTDecimalFromFloat(2.0f);
	axisSet.xAxis.minorTicksPerInterval = 1;
	axisSet.xAxis.minorTickLength = 5.0f;
	axisSet.xAxis.majorTickLength = 7.0f;

	axisSet.yAxis.title = @"Data Y";
	axisSet.yAxis.titleTextStyle = textStyle;
	axisSet.yAxis.titleOffset = 40.0f;
	axisSet.yAxis.axisLineStyle = lineStyle;
	axisSet.yAxis.majorTickLineStyle = lineStyle;
	axisSet.yAxis.minorTickLineStyle = lineStyle;
	axisSet.yAxis.labelTextStyle = textStyle;
	axisSet.yAxis.labelOffset = 3.0f;
	axisSet.yAxis.majorIntervalLength = CPTDecimalFromFloat(10.0f);
	axisSet.yAxis.minorTicksPerInterval = 1;
	axisSet.yAxis.minorTickLength = 5.0f;
	axisSet.yAxis.majorTickLength = 7.0f;

	// Add a plot to our graph and axis. We give it an identifier so that we
	// could add multiple plots (data lines) to the same graph if necessary.
	CPTScatterPlot *plot = [[[CPTScatterPlot alloc] init] autorelease];
	plot.dataSource = self;
	plot.identifier = @"mainplot";
	plot.dataLineStyle = lineStyle;
	plot.plotSymbol = plotSymbol;
	[self.graph addPlot:plot];
}

// Delegate method that returns the number of points on the plot
-(NSUInteger)numberOfRecordsForPlot:(CPTPlot *)plot
{
	if ( [plot.identifier isEqual:@"mainplot"] )
	{
		return [self.graphData count];
	}

	return 0;
}

// Delegate method that returns a single X or Y value for a given plot.
-(NSNumber *)numberForPlot:(CPTPlot *)plot field:(NSUInteger)fieldEnum recordIndex:(NSUInteger)index
{
	if ( [plot.identifier isEqual:@"mainplot"] )
	{
		NSValue *value = [self.graphData objectAtIndex:index];
		CGPoint point = [value CGPointValue];

		// FieldEnum determines if we return an X or Y value.
		if ( fieldEnum == CPTScatterPlotFieldX )
		{
			return [NSNumber numberWithFloat:point.x];
		}
		else	// Y-Axis
		{
			return [NSNumber numberWithFloat:point.y];
		}
	}

	return [NSNumber numberWithFloat:0];
}

@end
First of all, lets look at each of the methods above and describe what they do, and then we’ll look at some of the Core Plot objects that we make use of in the initialisePlot method.
So, initWithHostingView:andData simple initialises this object and retains a reference to the hosting view and data array which is fed to this method. initialisePlot is designed to be called shortly after the init method, but has been separated so that you can choose when the brunt of the work is done in creating the graph. This method provides the bulk of this class, which mostly consists of setting up the graph object with the required axis settings, line styles and label styles etc.
numberOfReportsForPlot: is a delegate method which simply returns the number of unique data points that exist for a given plot. If you are using this object as a delegate for multiple plots, you can determine which plot you should return data for by interrogating the identifier property - which you set earlier in the initialisePlot method. Finally, numberForPlot:field:recordIndex: will be called twice per data point in each plot. fieldEnum tells you whether the graph object is expecting the X or Y value for a given data point at index. Like with numberOfReportsForPlot, you can differentiate between multiple plots by first checking the identifier of the plot.
The intialisePlot method is fairly self-explanatory when reading it with the comments. However, it took me a while to get my head around the different objects made available by CorePlot. The CPTXYGraph represents an area into which a 2-dimensional graph will be drawn inside of a HostingView which exists in the parent UIView. The graph comes with it’s own plotAreaFrame (the area inside the graph that the actual data will be rendered), a plotSpace (the minimum and maximum values of X and Y that will be drawn on your chart) and an axisSet (essentially style and rendering options for the axis on this graph). You generally pull out a reference from the graph object for each of these and then manipulate them to design your chart.
The most prominent style and design objects you will use are; CPTMutableLineStyle - which represents a set of options for how a given line should be drawn (width / colour), CPTMutableTextStyle - a set of objects describing how a text label should be drawn (font, size, colour) and CPTPlotSymbol - representing an ellipse or cross for instance that will appear at the actual data points on your chart lines. When all of your chart framework is setup, you can then add one or more CPTScatterPlot objects to your graph - each one representing a unique data set or line on your chart. We only add one in this example and set the delegate to self (as we’ve set the delegate methods which return the data), a line style and a plot symbol. We also set an identifier incase we add more plots in the future so that the delegates can tell which plot the graph is expecting data for when calling a delegate method.
5. Hooking it all together
Last but not least, we need to bring all of these elements together and look at our creation. So, we need to create an IBOutlet for our Graph Hosting View in TUTViewController. Your TUTViewController.h should look like the following;
TUTViewController.h
#import
#import "CorePlot-CocoaTouch.h"
#import "TUTSimpleScatterPlot.h"

@interface TUTViewController : UIViewController <CPTPlotDataSource> {
	IBOutlet CPTGraphHostingView *_graphHostingView;
	TUTSimpleScatterPlot *_scatterPlot;
}

@property (nonatomic, retain) TUTSimpleScatterPlot *scatterPlot;

@end
Now, don’t forget to hook your CPTGraphHostingView from the TUTViewController back to the view that you added to the NIB right back at the start of this tutorial. Load up TUTViewController.xib and Ctrl-Click-Drag from ‘Files Owner’ to the Hosting View and then select graphHostingView as the outlet. We’ll create some sample data and then create the scatterPlot object in the viewWillAppear method of the View Controller;
TUTViewController.m
- (void)viewWillAppear:(BOOL)animated
{
[super viewWillAppear:animated];
NSMutableArray *data = [NSMutableArray array];
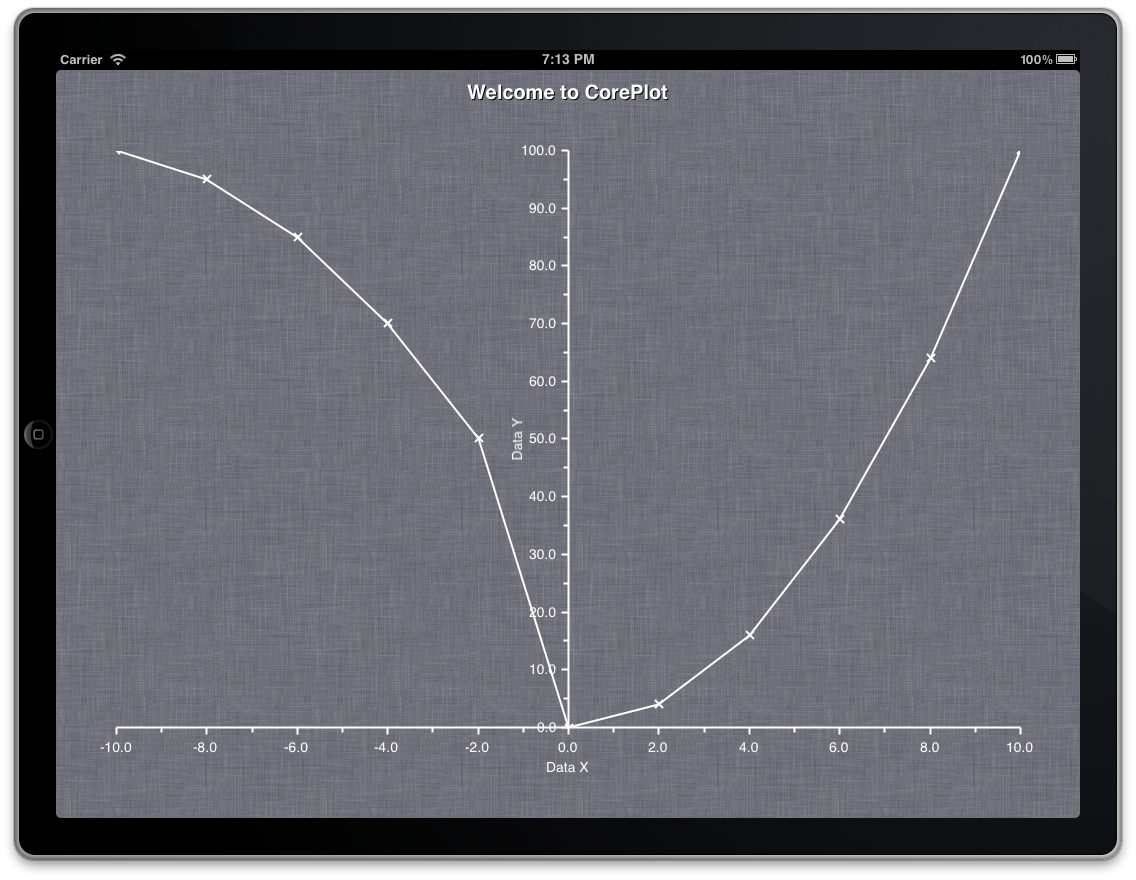
[data addObject:[NSValue valueWithCGPoint:CGPointMake(-10, 100)]];
[data addObject:[NSValue valueWithCGPoint:CGPointMake(-8, 50)]];
[data addObject:[NSValue valueWithCGPoint:CGPointMake(-6, 20)]];
[data addObject:[NSValue valueWithCGPoint:CGPointMake(-4, 10)]];
[data addObject:[NSValue valueWithCGPoint:CGPointMake(-2, 5)]];
[data addObject:[NSValue valueWithCGPoint:CGPointMake(0, 0)]];
[data addObject:[NSValue valueWithCGPoint:CGPointMake(2, 4)]];
[data addObject:[NSValue valueWithCGPoint:CGPointMake(4, 16)]];
[data addObject:[NSValue valueWithCGPoint:CGPointMake(6, 36)]];
[data addObject:[NSValue valueWithCGPoint:CGPointMake(8, 64)]];
[data addObject:[NSValue valueWithCGPoint:CGPointMake(10, 100)]];
self.scatterPlot = [[TUTSimpleScatterPlot alloc] initWithHostingView:_graphHostingView andData:data];
[self.scatterPlot initialisePlot];
}Note that we’re storing our data as a simple array of CGPoints. However, as CGPoints aren’t descended from NSObject, we can’t store them in an NSArray directly, so we wrap them up in an NSValue object within the array.
Anyway, phew, it feels like a lot of work - but we’re finally there. The golden spot of any tutorial - the screenshot of the final product!
If you’re having any problems getting this to work in your own app, then please don’t hesitate to get in touch by leaving a comment below - I’ll do my best to reply in a timely manner. If you want to download the code from the sample project, you can do so using the link below.
Download the Core Plot Introduction Xcode ProjectDownload Notes: You will need to change the interface definition of the TUTViewController class to the following in order to clear the build warning.
@interface TUTViewController : UIViewController <CPTPlotDataSource>